- Home
- Views On News
- Oct 4, 2023 - Why Indian Overseas Bank's (IOB) Share Price is Rising
Why Indian Overseas Bank's (IOB) Share Price is Rising
The Nifty PSU Bank index has surged by over 20% in 2023, while IOB's shares have witnessed a staggering 50% gain for the second consecutive year.
IOB's stock price embarked on a corrective phase in 2010, a period when PSU bank stocks lost their long-term bullish trend.
Over the next decade, from 2010 to 2020, IOB's stock corrected by more than 95%, leading to a prolonged consolidation phase that extended until mid-2021.
This phase of consolidation marked a crucial turning point for the stock price.
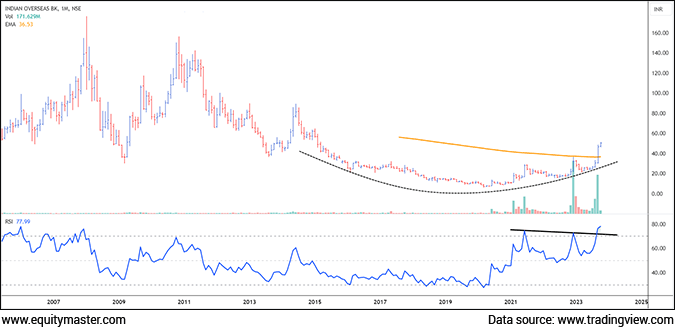
IOB Monthly Chart

Rounding Bottom Technical Pattern
The rounding bottom technical pattern is a key feature that emerged during the consolidation phase. This pattern signifies a potential reversal of the long-term downtrend.
The rounding bottom is characterised by a gradual, U-shaped curve on the price chart. It reflects a shift in sentiment from bearish to bullish as the stock finds a stable bottom.
The rounding bottom pattern is composed of several key elements:
1. Initial Downtrend: The pattern begins with a prolonged downtrend, as seen in stock prices from 2010 to 2020.
2. Consolidation Zone: Following the downtrend, the stock enters a consolidation zone, where the price movements become more balanced and less erratic. This consolidation was between 2020-2021.
3. Gradual Reversal: The rounding bottom pattern gradually forms as the stock shows signs of stabilisation and accumulation. This phase began in the first quarter of 2021 in the chart above.
4. Breakout: The pattern is considered complete when the price breaks above the resistance level, signalling a potential reversal of the long-term trend. This was confirmed in July 2021.
In the case of IOB, the rounding bottom pattern became evident during the consolidation phase. This pattern marked a significant turning point as it signalled the potential end of the prolonged bearish phase.
The Dow Theory
Another crucial aspect of IOB's turnaround was the establishment of a higher-high-lower-low structure of Dow Theory, which began to take shape in July 2021.
This structure indicated a shift in market sentiment as the stock price broke above the previous swing high of Rs 20.65.
Higher highs and higher lows are indicative of bullish momentum as per theory and suggest that the bulls have gained control of the long-term trend.
Long-Term Moving Average
The stock's breakout was further supported by its monthly close above the 200-month Exponential Moving Average (200MEMA), which was positioned at Rs 36.40.
Crossing this long-term average is significant as it signifies the end of the bearish scenario and a potential shift towards a bullish phase.
IOB's stock price breaking through the 200MEMA underscored the strength of the newfound bullish trend.
Volume Analysis
Volumes play a crucial role in confirming trends and identifying the participation of institutional investors and the smart money.
In December 2022 and September 2023, IOB's stock witnessed record-high volumes.
These spikes in trading activity indicate the accumulation of shares by savvy investors and institutions. Such heightened interest suggests a strong vote of confidence in the stock's future prospects.
Relative Strength Index (RSI)
The RSI, a momentum oscillator, is a valuable tool for assessing the strength of a trend.
In the case of IOB, the RSI broke above the resistance zone, signalling long-term strength in the trend.
This breakout in RSI suggests that the stock is not only on an upward trajectory but also has the potential for further gains.
Conclusion
The significant rise in IOB's share price over the past two years can be attributed to a bullish chart pattern as per technical analysis.
The emergence of the rounding bottom pattern, establishment of higher highs and higher lows, and crossing the 200MEMA all point to a bullish trend reversal.
Concurrently, institutional interest, reflected in record-high volumes, and a strong RSI breakout, provide further evidence of IOB's newfound strength.
As always, it is important for investors to conduct thorough research and consider both technical and fundamental aspects before making investment decisions.
While IOB's recent performance is encouraging, prudent investment strategies should be based on a holistic assessment of market conditions and the bank's fundamentals.
Disclaimer: This article is for information purposes only. It is not a stock recommendation and should not be treated as such. Learn more about our recommendation services?here...

Brijesh Bhatia Research Analyst and expert chartist, is the editor of Alpha Wave Profits. Fully committed to his craft, Brijesh has mastered the art of making money by trading using technical analysis. Brijesh has an MBA from ICFAI and 16 years of experience in India's financial markets. He began his career on Dalal Street as commodities dealer and it wasn't long before he developed his own unique trading system. Brijesh worked on his trading system until it could be expected to deliver 5 units of return for every unit of risk.


Equitymaster requests your view! Post a comment on "Why Indian Overseas Bank's (IOB) Share Price is Rising". Click here!
Comments are moderated by Equitymaster, in accordance with the Terms of Use, and may not appear
on this article until they have been reviewed and deemed appropriate for posting.
In the meantime, you may want to share this article with your friends!